- Introduction
- What Is a Complex Waveform?
- Types of Complex Waveforms
- Key Characteristics of Complex Waveforms
- Fourier Series: Decomposing Complex Waveforms
- Key Oscilloscope Features for Complex Waveform Analysis
- Steps to Analyze a Complex Waveform
- Tips for Accurate Waveform Analysis
- Why Complex Waveforms Matter in Engineering
- Telecommunications
- Power Systems
- Audio Engineering
- Digital Circuits
- Conclusion
- Whenever You’re Ready, Here Are 5 Ways We Can Help You
Did you know that most real-world signals aren't simple sine waves?
Whether you're dealing with audio signals, digital clocks, or power electronics, the waveforms you encounter are often far more intricate.
These signals are known as complex waveforms. Understanding them is essential if you want to analyze and troubleshoot systems accurately.
Complex waveforms play a crucial role in fields like telecommunications, audio engineering, and digital signal processing. But what exactly makes them complex, and how can you break them down for analysis?
Let's explore the characteristics, decomposition, and analysis of complex waveforms.
| Key Takeaway |
|---|
| Complex waveforms are essential in real-world engineering applications, from telecommunications to power systems and digital circuits. Understanding and accurately analyzing these signals ensures reliable performance, minimizes errors, and helps optimize system efficiency. |
What Is a Complex Waveform?
A complex waveform is any signal that deviates from a simple sine wave.
Unlike pure sine waves, which have a single frequency, complex waveforms consist of multiple sinusoidal components with varying frequencies, amplitudes, and phases.
Types of Complex Waveforms
Within complex waveforms, there are several main categories to be distinguished:
1. Square Wave
- Description: Alternates between two levels (high and low) with equal duration.
- Applications: Digital electronics, clock signals.
- Harmonics: Contains only odd harmonics.
2. Triangular Wave
- Description: Linear rise and fall with equal slopes.
- Applications: Modulation signals, audio synthesis.
- Harmonics: Contains odd harmonics with amplitudes decreasing as 1 / n².
3. Sawtooth Wave
- Description: Linear rise followed by a sudden drop.
- Applications: Oscilloscope sweep signals, music synthesis.
- Harmonics: Contains all harmonics (odd and even).
| Waveform Type | Typical Applications | Harmonics |
|---|---|---|
| Square Wave | Digital clocks, circuits | Odd harmonics |
| Triangular Wave | Modulation, audio synthesis | Odd harmonics, 1 / n² falloff |
| Sawtooth Wave | Oscilloscope sweeps, audio | All harmonics (odd & even) |
Key Characteristics of Complex Waveforms
All complex waveforms have fundamental properties that help you analyze them effectively:
1. Period (T):
The time it takes for a waveform to complete one cycle. Measured in seconds (s).
2. Frequency (f):
The number of cycles a waveform completes per second.
Formula: f = 1 / T (measured in hertz, Hz)
3. Amplitude:
The maximum value (or peak) of the waveform, typically measured in volts (V).
4. Phase:
The time shift between different components of a waveform.
Fourier Series: Decomposing Complex Waveforms
Any periodic complex waveform can be broken down into a sum of simple sine waves using the Fourier series. This series expresses the waveform as a combination of:
- A fundamental frequency (f)
- Harmonics (integer multiples of the fundamental frequency)
General Formula for a Fourier Series:
\(f(t) = a_0 + Σ (a_n * cos(2π * n * f * t) + b_n * sin(2π * n * f * t))\)
Where:
- \(a_0\) is the average (DC) component
- \(a_n\) and \(b_n\) are coefficients representing the amplitudes of the cosine and sine components
- n is the harmonic number
Example of Harmonic Decomposition
For a square wave with a fundamental frequency f, the harmonic components are:
- 1st Harmonic: f (fundamental frequency)
- 3rd Harmonic: 3f
- 5th Harmonic: 5f
- nth Harmonic: nf (only odd harmonics are present)
By summing these harmonics, you can approximate the original square wave.
Key Oscilloscope Features for Complex Waveform Analysis
To effectively analyze complex waveforms, oscilloscopes offer a range of powerful features designed to break down, visualize, and measure intricate signal characteristics. Here are essential capabilities you can leverage for accurate waveform analysis:
1. Time Domain Analysis
Time domain analysis lets you visualize how a signal changes over time. By viewing the waveform in this domain, you can identify:
- Voltage levels: Measure peaks, troughs, and average values.
- Pulse width: Analyze the duration of signal high and low states.
- Rise and fall times: Observe how quickly a signal transitions between states.
- Distortions and anomalies: Spot glitches, noise, or irregularities in the waveform.
2. Frequency Domain Analysis (FFT)
Using the Fast Fourier Transform (FFT) function, you can convert the waveform from the time domain into the frequency domain. This reveals the harmonic content of the signal, allowing you to:
- Identify frequency components: See the fundamental frequency and harmonics.
- Analyze signal quality: Detect unwanted noise or spurious frequencies.
- Filter and isolate frequencies: Focus on specific frequency ranges to troubleshoot issues.
Pro Tip: Use FFT mode with appropriate windowing functions (like Hanning or Hamming) to reduce spectral leakage and improve frequency resolution.
3. Mixed-Signal Analysis
Mixed-signal oscilloscopes (MSOs) allow you to analyze analog and digital signals simultaneously.
This is useful for systems with both analog waveforms (e.g., power supplies) and digital logic signals (e.g., microcontroller outputs). Key benefits include:
- Correlation of signals: Compare analog and digital signals in real time.
- Logic analysis: Decode digital protocols like I2C, SPI, or UART.
- Triggering flexibility: Set triggers for specific digital events while monitoring analog behavior.
4. Advanced Triggering
Modern oscilloscopes offer sophisticated triggering options to isolate specific waveform events. Examples include:
- Edge Triggering: Trigger on rising or falling edges.
- Pulse Width Triggering: Trigger on pulses that exceed or fall below a specified width.
- Glitch Triggering: Capture infrequent glitches or anomalies.
- Runt Triggering: Detect signals that don’t fully transition to expected levels.
Steps to Analyze a Complex Waveform
1. Connect the Signal
- Attach the oscilloscope probe to the signal source.
- Ensure a good ground connection to avoid noise or interference.
- Use the appropriate probe type (e.g., passive, active, or differential) for the signal being measured.
2. Set the Time Base
- Adjust the horizontal scale to display multiple cycles of the waveform.
- Start with a broad view, then zoom in to analyze specific details.
3. Adjust Vertical Scale
- Set the vertical scale to fit the waveform within the display.
- Fine-tune the sensitivity to capture subtle variations in signal amplitude.
4. Set Triggering
- Select a suitable trigger type (edge, pulse width, glitch, etc.) to stabilize the waveform.
- Adjust the trigger level to capture the desired part of the signal.
- Use a hold-off setting to prevent the oscilloscope from retriggering too quickly.
5. Use FFT Mode for Frequency Analysis
- Activate FFT mode to convert the signal to the frequency domain.
- Adjust the frequency span and resolution to identify harmonic content accurately.
- Look for peaks corresponding to the fundamental frequency and harmonics.
6. Measure Characteristics
Use on-screen cursors and measurement tools to analyze:
- Period (T): Time for one complete cycle.
- Frequency (f): Number of cycles per second, calculated as f = 1 / T.
- Amplitude: Peak-to-peak or RMS voltage levels.
- Rise/Fall Time: Time for the signal to transition between levels.
- Phase Shift: Compare phase differences between multiple signals.
7. Save and Document Data
- Capture screenshots or save waveform data for future analysis.
- Document measurements and observations to assist with troubleshooting or reporting.
Tips for Accurate Waveform Analysis
- Bandwidth matching: Ensure the oscilloscope's bandwidth is suitable for the signal's highest frequency components.
- Sample rate: Use a sample rate at least 10 times higher than the signal frequency to avoid aliasing.
- Probe calibration: Regularly calibrate probes to maintain measurement accuracy.
- Noise reduction: Use signal averaging or bandwidth filters to reduce noise during measurements.

Why Complex Waveforms Matter in Engineering
Complex waveforms play a critical role in many engineering applications, making it essential for engineers to understand and analyze them accurately.
In real-world systems, signals are rarely simple sine waves; they often contain multiple frequency components, abrupt transitions, and varying amplitudes.
Here’s why understanding complex waveforms is crucial across various fields:
Telecommunications
In modern communication systems, data is transmitted using modulated signals that combine multiple frequency components. For example:
- Digital signals: Data streams often use square waves to represent binary information. Accurate analysis ensures proper signal integrity and minimizes errors.
- Modulated signals: Techniques like AM (Amplitude Modulation), FM (Frequency Modulation), and QAM (Quadrature Amplitude Modulation) produce complex waveforms to carry data over different channels.
Analyzing these signals helps you detect issues like noise, distortion, and bandwidth limitations, ensuring reliable communication.
Power Systems
Power electronics generate complex waveforms due to the switching behavior of devices like inverters, converters, and rectifiers. Key applications include:
- Switching power supplies: These supplies create high-frequency switching waveforms, which can introduce harmonics and EMI (Electromagnetic Interference).
- Grid analysis: Understanding the harmonics in AC power distribution helps maintain power quality and prevent equipment damage.
Accurately analyzing these waveforms helps optimize efficiency and reduce issues like voltage distortions and power losses.
Audio Engineering
In audio systems, signals rarely remain pure sine waves.
Musical instruments, human voices, and sound effects produce complex waveforms with rich harmonic content. Key applications include:
- Signal processing: Decomposing waveforms allows you to apply filters, equalization, and noise reduction.
- Audio synthesis: Generating realistic sound effects or music often involves creating and manipulating complex waveforms.
Proper analysis ensures clear, high-fidelity sound reproduction without unwanted noise or distortion.
Digital Circuits
Digital systems operate with square and pulse waveforms to represent logical states. Applications include:
- Clock signals: Digital devices rely on precise timing from clock signals to synchronize operations.
- Data buses: Complex waveforms on data lines can reveal issues like signal integrity problems, reflections, and crosstalk.
Understanding these waveforms helps ensure reliable operation of processors, memory, and communication interfaces.
Conclusion
Analyzing complex waveforms requires a clear understanding of waveform characteristics, decomposition methods like Fourier analysis, and the effective use of oscilloscopes.
By leveraging time-domain, frequency-domain, and mixed-signal analysis, you can accurately measure and troubleshoot intricate signals. Advanced triggering, FFT modes, and proper measurement techniques ensure you capture and interpret signals effectively.
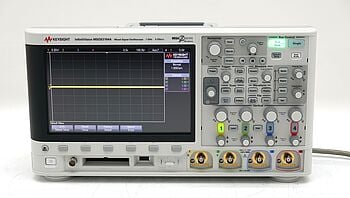
For reliable and accurate analysis, having the right testing equipment is essential. Keysight’s Used Equipment Store offers premium, pre-owned oscilloscopes, signal generator, function generators, and multimeters. Get the quality and performance you trust at a lower cost and with faster delivery times.

Whenever You’re Ready, Here Are 5 Ways We Can Help You
- Browse our Premium Used Oscilloscopes.
- Call tech support US: +1 800 829-4444
Press #, then 2. Hours: 7 am – 5 pm MT, Mon– Fri - Talk to our sales support team by clicking the icon (bottom right corner) on every offer page
- Create an account to get price alerts and access to exclusive waitlists.
- Talk to your account manager about your specific needs.
