- Introduction
- Understanding Coordinate Frames
- Types of Coordinate Frames
- Understanding Coordinate Systems
- Application of Coordinate Frames in Electrical Engineering
- Waveform Analysis
- Frequency Spectrum Analysis
- Impedance Calculations
- Transformations Between Coordinate Frames
- Transformations in 2D Space
- Transformations in 3D Space
- Transformations in Complex Impedance
- Data Visualization and Interpretation
- Signal Representation
- Phasor Diagrams
- Smith Chart
- Conclusion
- Whenever You’re Ready, Here Are 5 Ways We Can Help You
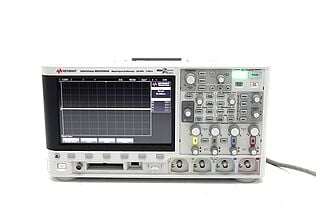
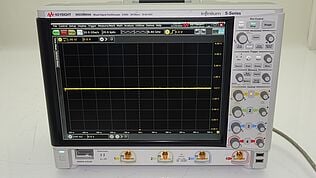
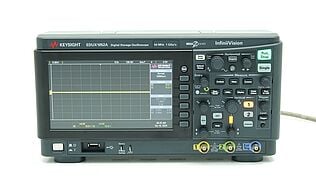
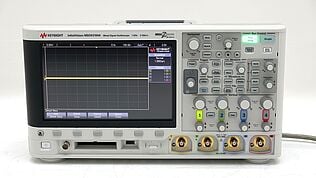
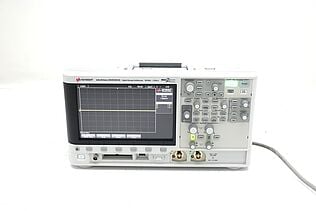
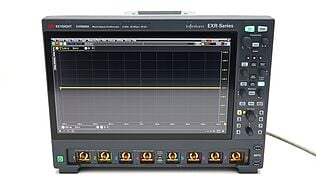
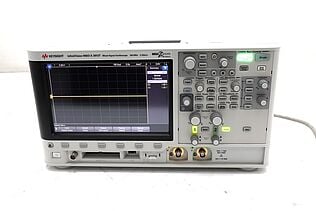
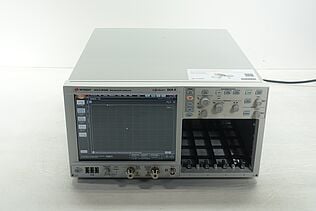
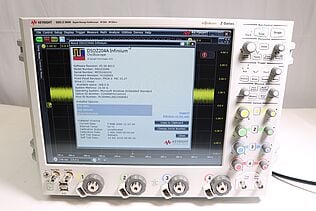
Did you know that every time you use an oscilloscope to measure electrical signals, you're relying on the concept of coordinate frames? Yes, that's right. Coordinate frames form the very fabric of the mathematics behind electronic testing equipment and navigation tools. They are the foundation of every plot, every waveform, and every 3D visualization you encounter.
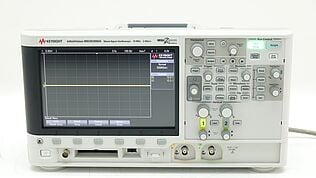
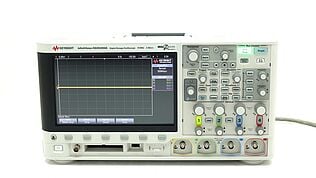
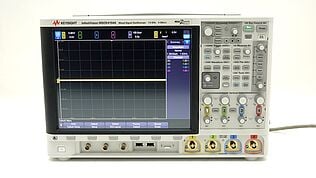
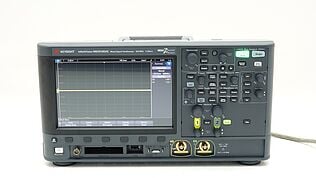
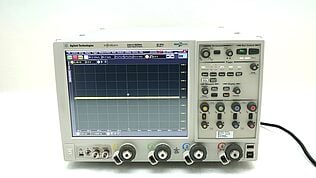
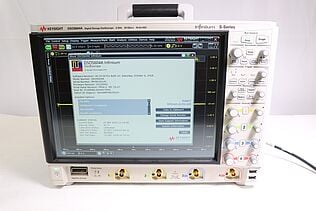
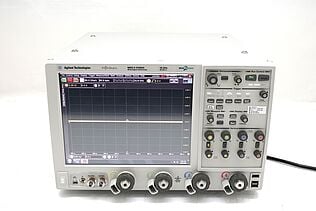
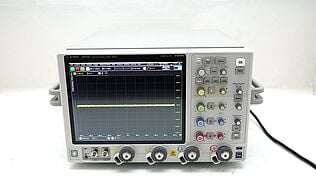
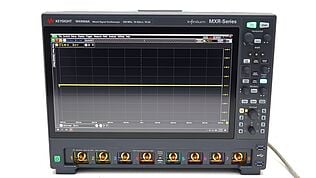
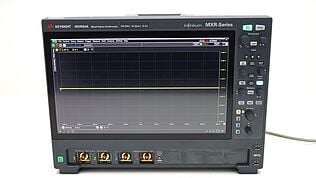
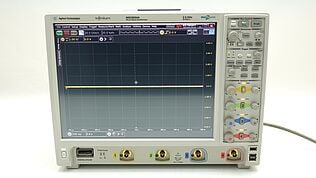
Buy Oscilloscopes at a Great Discount
Understanding Coordinate Frames
A coordinate frame, also referred to as a reference frame, is a mathematical tool used to describe the position or orientation of objects or points in space. Think of it as a perspective from which measurements are made. It's essentially a way to assign a set of numbers to a point in a space, so that you can compare positions or motions of different points.
When we use oscilloscopes and similar testing equipment, we rely on coordinate frames to understand the measurements in context. The coordinate frame provides a structured way to look at waveforms, allowing us to analyze their characteristics like amplitude, frequency, and phase in a defined space.
Types of Coordinate Frames
In general, there are two types of coordinate frames:
- Global (or absolute) coordinate frame: This is a fixed frame, often used as a reference point for all other measurements. In an oscilloscope, the origin (0,0 point) of the graph would be a global coordinate frame.
- Local (or relative) coordinate frame: This is based on a specific object or point in space. It can change depending on the object's position or orientation.
| Key Takeaway |
|---|
| Coordinate frames are an indispensable tool in electrical engineering, providing a structured way to visualize and analyze complex electronic signals. They enhance our understanding of waveforms, frequency spectra, and impedance, simplifying problem-solving and facilitating effective data interpretation. |
Understanding Coordinate Systems
A coordinate system, which is closely related to the coordinate frame, is essentially a rule that connects each point in a space to a set of numbers called coordinates.
For example, the Cartesian coordinate system uses x, y, and z coordinates to define any point in a three-dimensional space. On an oscilloscope, we often work with a 2D Cartesian system, where the x-axis might represent time, and the y-axis represents the voltage.
Other common coordinate systems include:
- Polar coordinates
- Cylindrical coordinates
- Spherical coordinates
Each of these systems has its own unique advantages and uses in various fields of engineering and science.
| Coordinate System | Dimensions | Common Use |
| Cartesian | 2D, 3D | General engineering, physics, mathematics |
| Polar | 2D | Oscillatory phenomena, circular motion |
| Cylindrical | 3D | Cylindrical objects, waveguides |
| Spherical | 3D | Celestial mechanics, quantum mechanics |
Application of Coordinate Frames in Electrical Engineering
In the realm of electrical engineering, and particularly when using oscilloscopes, coordinate frames enable us to make sense of complex electronic signals.
Waveform Analysis
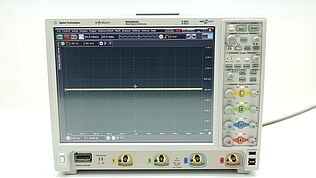
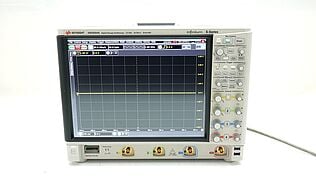
When analyzing electronic signals with an oscilloscope, the most common view is a graph of an electrical signal as a function of time. Here, the 2D Cartesian system of an oscilloscope comes into play. This view is essentially a waveform, where the x-axis (horizontal) represents time and the y-axis (vertical) signifies voltage or current.
This visual representation of electronic signals helps engineers assess a multitude of waveform characteristics:
- Amplitude: The height of the waveform on the oscilloscope screen indicates its amplitude. It can represent various attributes depending on the context, such as the voltage of an electronic signal or current passing through a component.
- Frequency: Frequency is the rate at which a waveform repeats per unit of time and is measured in Hertz (Hz). In the time-domain Cartesian coordinate frame, frequency is determined by measuring the time between two identical points on consecutive waveforms.
- Phase: Phase describes the time offset between two waveforms. It is important when comparing two waveforms of the same frequency. The Cartesian coordinate frame facilitates phase comparison by allowing the waveforms to be visually overlaid.
Frequency Spectrum Analysis
With an oscilloscope equipped with a Fast Fourier Transform (FFT) feature, you can switch from the time-domain view (waveform) to the frequency-domain view (spectrum). This switch essentially changes the Cartesian coordinate frame from time-amplitude to frequency-amplitude.
In the frequency-domain view, the x-axis represents frequency, and the y-axis denotes the amplitude of the signal at each frequency. This display allows for the identification and analysis of individual frequency components within a complex signal, which is crucial in areas such as signal processing, communication systems, and control systems.
Impedance Calculations
Impedance is a critical aspect of AC circuit analysis, representing the total resistance that a circuit presents to an alternating current. It's a complex quantity consisting of resistance (real part) and reactance (imaginary part).
- Cartesian coordinate frame: In this frame, the x-axis (real axis) represents resistance, and the y-axis (imaginary axis) represents reactance. This frame makes adding and subtracting complex impedances straightforward, a crucial feature in parallel AC circuit analysis.
- Polar coordinate frame: In this system, a complex impedance Z is represented by its magnitude (|Z|) and phase angle (θ). This frame simplifies multiplication and division of complex impedances, which is beneficial in series AC circuit analysis.
In both cases, the use of coordinate frames provides a structured method to visualize, calculate, and understand the behavior of complex impedances in AC circuits. Each frame, Cartesian or polar, offers unique advantages depending on the specific type of analysis being performed.
Transformations Between Coordinate Frames
Transformations are a fundamental aspect of coordinate frames, enabling conversion between different frames and systems. This process is pivotal in many areas of engineering and science, including robotics, navigation, and computer graphics, among others.
Transformations in 2D Space
In the realm of 2D space, such as in an oscilloscope, transformations can involve the following:
- Translation: Shifting the entire graph along an axis
- Rotation: Turning the graph around an axis
- Scaling: Increasing or decreasing the size of the graph
Understanding these transformations helps in interpreting the measurements on the oscilloscope, especially when the signals or the scales are altered in some way.
Transformations in 3D Space
In 3D space, transformations get a bit more complex and involve additional operations. But the principles remain the same: you can translate, rotate, and scale a 3D graph.
The transformation between 3D Cartesian and spherical coordinates is a key aspect in analyzing 3D waveforms or fields in electromagnetics. For example, the radiation pattern of an antenna is frequently depicted using spherical coordinates, which require the conversion from the physical antenna layout's Cartesian coordinates.
Transformations in Complex Impedance
In the case of complex impedance, the transformation between the Cartesian and polar coordinate frames corresponds to the conversion between rectangular (R + jX) and polar (|Z|∠θ) forms of complex numbers.
Understanding these transformations is essential when performing various circuit analyses, as each form has its own advantages: rectangular form simplifies addition and subtraction of complex impedances, while polar form simplifies multiplication and division.
Data Visualization and Interpretation
Visualization is a vital component of data analysis, and the choice of coordinate frames significantly impacts how data is presented and interpreted. In the context of electrical engineering, coordinate frames aid in displaying, comprehending, and interpreting data in several ways.
Signal Representation
As discussed earlier, oscilloscopes use a 2D Cartesian coordinate system to represent electrical signals as a function of time. This representation facilitates the visualization of signal properties, such as amplitude, frequency, and phase shift. By changing the coordinate frame, we can also transition into the frequency domain, using FFT, to analyze the spectral properties of signals.
Phasor Diagrams
Phasor diagrams are another prime example of the use of coordinate frames in data visualization. In this case, the polar coordinate frame is used to depict the amplitude and phase of sinusoidal signals.
Each signal is represented as a vector (phasor) in the complex plane, and the magnitude and direction of the vector correspond to the amplitude and phase of the signal.
Smith Chart
The Smith Chart is a specialized graphical tool used in radio frequency (RF) engineering to represent complex impedance and reflection coefficients. It employs both the polar and rectangular coordinate frames for efficient problem-solving in RF circuit design and analysis. It's particularly useful in visualizing how parameters like impedance and reflection coefficients change with frequency.
The ability to visualize and interpret data through appropriate coordinate frames is essential in electrical engineering. It enables engineers to comprehend complex electrical behaviors and perform accurate analyses, thus driving better design and decision-making processes.
Conclusion
Coordinate frames serve as the backbone of numerous applications, particularly in the realm of electrical engineering. Whether we're analyzing waveforms on an oscilloscope, exploring the frequency components of a complex signal, or delving into impedance calculations for AC circuits, the choice of coordinate frame significantly influences our methods and insights.
From Cartesian to polar, each frame offers a unique perspective, allowing us to effectively visualize, understand, and communicate the intricacies of electrical phenomena. They enable us to transform between different perspectives, facilitating flexible problem-solving approaches.
Coordinate frames aren't just abstract mathematical concepts. They're instrumental in our daily encounters with electrical engineering, underpinning the way we observe, measure, and interpret electronic signals.
To accurately interpret measurements and signals, you need reliable and precise testing equipment. The right tools can amplify the power of coordinate frames, turning these mathematical constructs into practical resources for your engineering work.
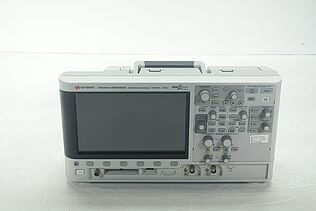
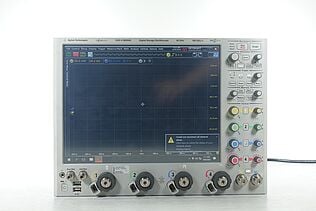
Check out Keysight's Used Equipment Store for the best in testing equipment. You will find high-quality oscilloscopes, signal analyzers and network analyzers at a fraction of the original price. Find the best tools to help you leverage the power of coordinate frames and take your electrical engineering projects to the next level!
Browse Oscilloscopes at a Great Discount
Select up to 3 instruments to compare
Enable Notifications
In order to use this feature, you need to enable notifications.
Manage notification preferences
Whenever You’re Ready, Here Are 5 Ways We Can Help You
- Browse our Premium Used Oscilloscopes.
- Call tech support US: +1 800 829-4444
Press #, then 2. Hours: 7 am – 5 pm MT, Mon– Fri - Talk to our sales support team by clicking the icon (bottom right corner) on every offer page
- Create an account to get price alerts and access to exclusive waitlists.
- Talk to your account manager about your specific needs.

